Performance Test vs. Diagnostic: What Is the Difference?
A test shows you WHAT a body can do. A diagnostic shows you HOW it does it. Why that difference decides whether your Zone 2 is actually a Zone 2.

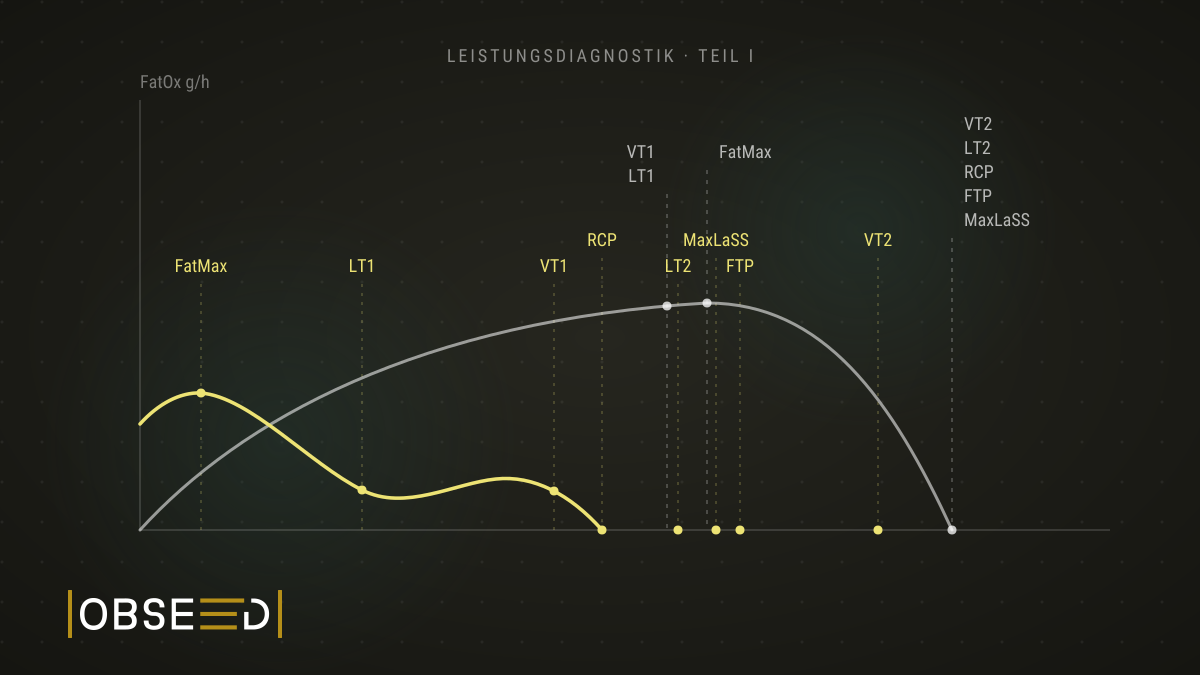
Performance diagnostics is once again one of those topics that seems to raise more questions than it answers. In this short series we try to shed some light on it and answer at least a few of them. Part I: performance test vs. diagnostic.
And here we go already: these terms are actually clearly defined, but by now they have been through a process not unlike a game of telephone. What gets whispered into the first ear at one end rarely comes out the same at the other.
Sorry, what?
One problem that shows up in scientific work is that language barriers are far stronger than we make ourselves aware. If a study is conducted in German, documented in English and evaluated in Italy, it happens quickly that terms get translated not quite correctly or ambiguously. And then it takes its course…
To the point: what is the difference between a performance TEST and a DIAGNOSTIC?
Let us go to the root:
The definition of a test could be phrased like this: A test is a targeted examination or an attempt. It tells you whether something specific works, how good a performance is, or whether an assumption holds. Unlike an experiment, in a test you already know the goal or the expectation beforehand.
And what does that look like for a diagnostic?
A diagnostic is the entirety of all methods and steps used to examine the state of a person (or a technical system) and to arrive at a precise diagnosis (the recognition or naming of a disease or a problem). It forms the basis for any further treatment.
That does not make things much clearer, because if you set the bar loosely enough, you could even call a simple 5km time trial or an FTP test a diagnostic. Unfortunately that is often exactly what happens, which is why it is not always easy to find common ground. Results get presented as facts far too quickly when they are really just possibilities, and that can cause problems.
Maybe we need to phrase the question differently. Where could the differences between test and diagnostic actually lie?
The basic rule: both require a protocol that is as simple, clear and reproducible as possible. Whether it is a test to check one specific thing (for example: how fast can I run 5km on a track?) or a diagnostic that uses multiple steps (as in a graded exercise test with spiroergometry) under clearly defined conditions to capture as completely as possible how a body works under load: that reproducibility is the be-all and end-all of the fundamentals.
The biggest difference is then the measurement itself, and here we can perhaps close the circle: a performance TEST shows us WHAT a body can do. A DIAGNOSTIC shows us HOW it does it.
One level deeper: a performance test gives us, for example, the status quo of the time needed for a predefined distance, or the power output for a given duration. A diagnostic shows how the body works at which power or speed. Meaning: how much oxygen it takes up, how much energy it needs, how much fat it burns, how many carbohydrates, how much protein. How its heart works, how its respiratory system functions, how the cells handle the oxygen, how economically the body works, whether the system is overloaded and / or stressed…
But… Zwift and all the rest tell me that too, don’t they?
This is where it gets complex again. Yes, it is entirely possible that a 20min FTP test on Zwift will tell you where your “Zone 2” is. And if you then type that term into a search engine of any kind, you might get a description like this:
In Zone 2 training the body is in a low-intensity range with purely aerobic energy production, effectively building basic endurance. It corresponds to roughly 60 to 75 % of maximum heart rate.
The body covers 80 to 90 % of its energy demand from its own fat stores. Because sufficient oxygen is available, fat burning (lipolysis) is optimised. The valuable glycogen stores (carbohydrates) in the muscle are spared for later, more intense efforts.
The load signals the muscle cells (type I fibres) to build new mitochondria and enlarge existing ones. These cellular “power plants” convert fat and oxygen into energy. The more mitochondria are active, the longer the body can work without fatiguing.
…which actually sounds good. Only… is that really the case?
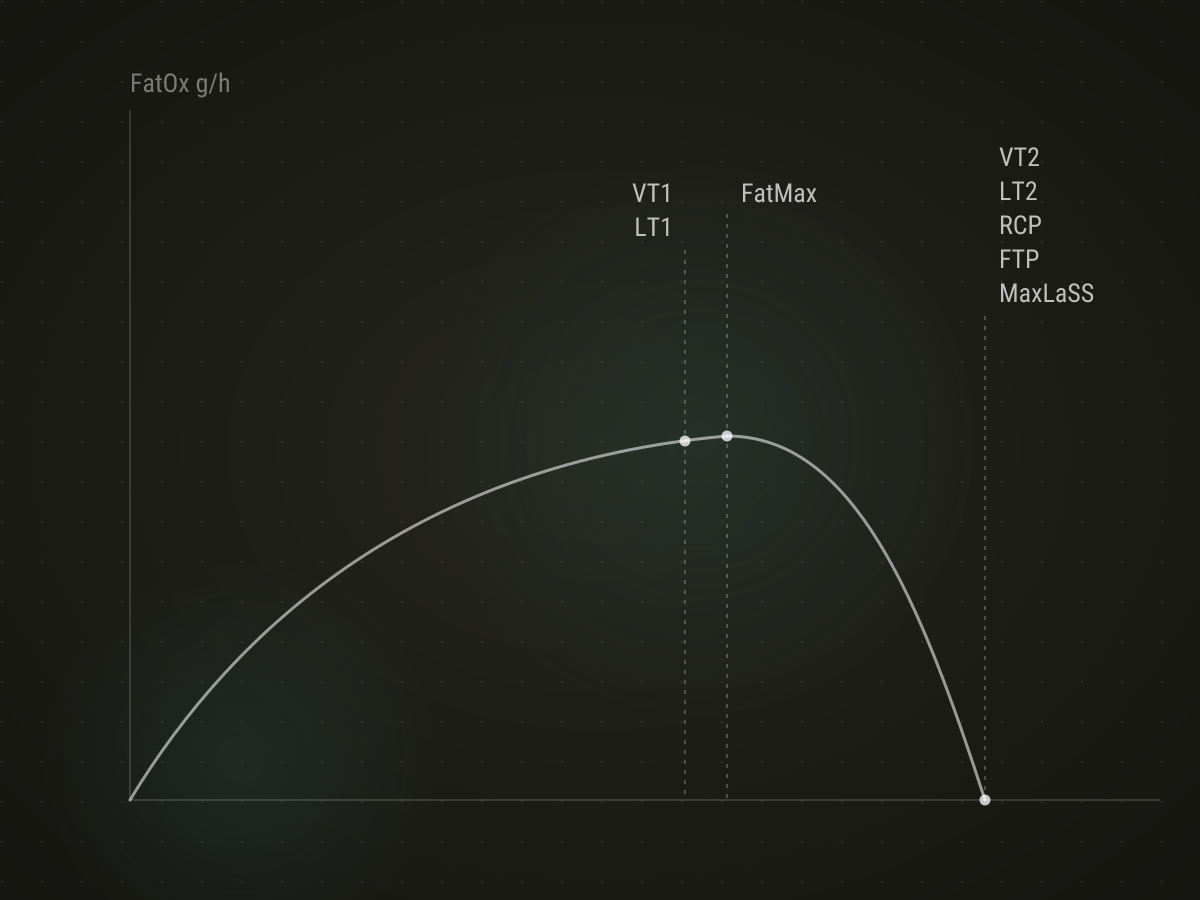
This is what the calculation looks like: a clean arc, the thresholds neatly sorted, FatMax exactly where it belongs. What all those terms actually mean is something we will sort out in part 2.
Enter: the game of statistics, reference groups and reality
At the start of this game of telephone stood bright minds who were trying to simplify laboratory testing and reproduce the results obtained there out in the field. The motivation was and still is obvious: take a cycling squad travelling to a training camp somewhere in the mountains. Far away from most technology, there is hardly any way to run tests regularly and, above all, in a standardised way to tell you how training is affecting the body.
What is possible at any time, however, is to have a whole team ride up the same mountain flat out for 20min, on different days as well…
…which in the end is exactly what still happens in an FTP test today. The developers of this method, Hunter Allen and Dr. Andrew Coggan, had found in the lab that a cyclist’s* maximum one-hour power was located fairly precisely where his anaerobic threshold was. And that this one-hour power was almost exactly 95% of the power the same cyclist could hold for a maximum of 20min. And that 56-75% of THAT value in turn roughly corresponded to the range the descriptions above applied to.
In short: they had found a way to reproduce threshold and zone determination for their cyclists in the field, without having to transport a highly complex medical laboratory into, say, the Rocky Mountains.
Only…
Let us come to our asterisk*: the word used was deliberately cycliSTS, because these tests and investigations focused on a very small and clearly defined demographic. Male, Caucasian, 26 to maybe 32 years old at most, fully trained or already a professional cyclist.
So for a very small and clearly defined group of male athletes, a method had been developed that made the lab partly obsolete – and the “diagnostic at home” moved into the living rooms, pain caves and training rooms of this world.
And why? Why was this, and still is this, almost never questioned?
Probably for two simple reasons. First, every remotely ambitious cyclist would like to be able to claim the same power numbers as a professional. Instagram and Strava are the best proof of that: “310 watts normalised power, good Zone 2 training”… statements like these are not rare. And second… well, because “it feels right to me!”. In the end no holy water helps against one’s own perception, and any definition becomes moot.
But what does the real world look like?
Here the numbers from actual laboratories come to our aid. For example the one at our partner company, the Tricademy – School of Movement.
In the autumn of 2024 the Tricademy got to run its 1’000th diagnostic. What deserves particular emphasis: all tests followed the same standardised and validated protocol and were measured with equipment that does not merely meet the medical gold standard but rather sets it. And there was not one specific test group, but a wide range of athletes at every conceivable fitness level and across an age span from 16 to 76 years.
What follows is not a published study, but the internal, anonymised evaluation of those 1’000 diagnostics. We say that plainly because the difference matters. The questions asked were:
In how many cases did the anaerobic threshold match FTP?
In how many cases was Zone 2 where the calculation said it should be?
In how many cases did energy production there actually come 80-90% from fat?
The answer was as clear as it was simple: in a single subject.
And he was… Caucasian, 28 years old at the time of testing, fully trained and a professional athlete…
By now there are considerably more, but the statement has stayed the same so far. The chance that you are actually training the fundamentals, building mitochondria and mainly burning fat inside a calculated Zone 2 is smaller than 1 in 1’000.
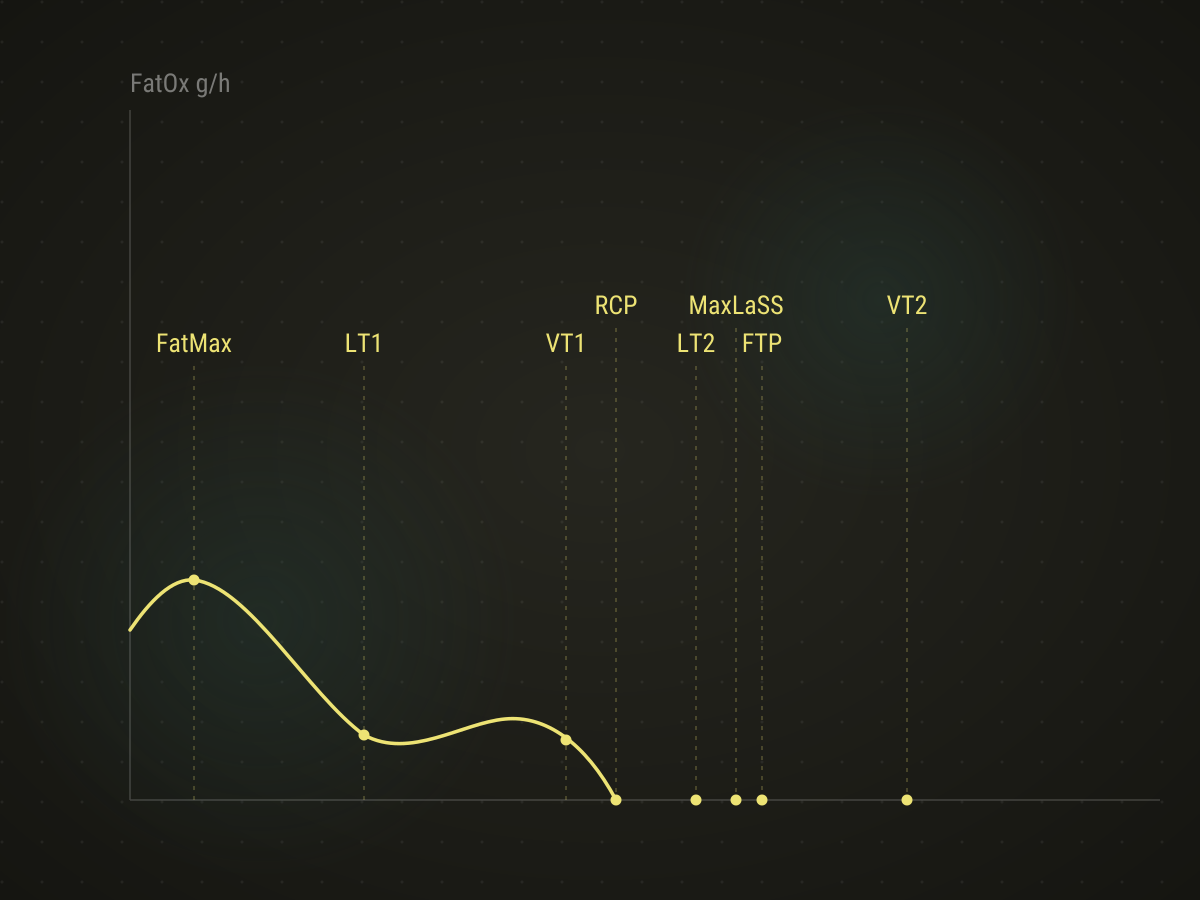
And this is what the measurement looks like – same axis, same scale. The maximum arrives far too early and sits far too low, and the thresholds scatter across the whole range. Internal, anonymised evaluation by the Tricademy, n=1’000 – not a published study.
That the calculation does not add up shows up elsewhere too, by the way. A study of 761 people found the point of maximum fat oxidation at an average of 35 to 43% of peak power output – and at a different place depending on fitness level. So a fixed percentage cannot possibly fit everyone.
Time for some perspective
What would we knowingly do if the prospect of success were 1 in 1’000?
We would not board a plane, not accept an anaesthetic, not cross the street. We would not even take an aspirin.
So why does it not frighten us when it comes to putting our own health on the line?
Presumably for the reasons given above. It does not feel like anything is wrong, so it must be right. After all, I am the one inside my body and I know it best. Right?
Let us take another look at the statistics and ask: how large were the differences?
If you ask Google how high maximum fat oxidation is on average in trained people, you get the answer that it sits at roughly 35-45 grams per hour (short: g/h).
In fairly stark contrast to that stands the evaluation of those tests, which shows very clearly that the average FatMax value is closer to 15-22g/h. What is not rare, however, are amounts well above 140-190 grams of carbohydrate per hour being burned in Zone 2. And there is no way to talk that up: at that energy demand you can no longer speak of fundamentals. The body is under the highest possible stress.
But there is good news too. With the right training, a great deal can be achieved in these areas. It just takes a diagnostic, not a test. And you should know which value you can trust in the first place – that goes for the VO2max from your watch just as much as for the Zone 2 from a calculation.
These results can also be imported directly into obseed. With our Energy Spread you have several options for linking your data directly to your training sessions, so you can follow what is actually going on inside your body while you train.
In our next article, part 2 of this short series, we will talk about thresholds and maximum values and hopefully shed a little more light on the subject.
Read Next
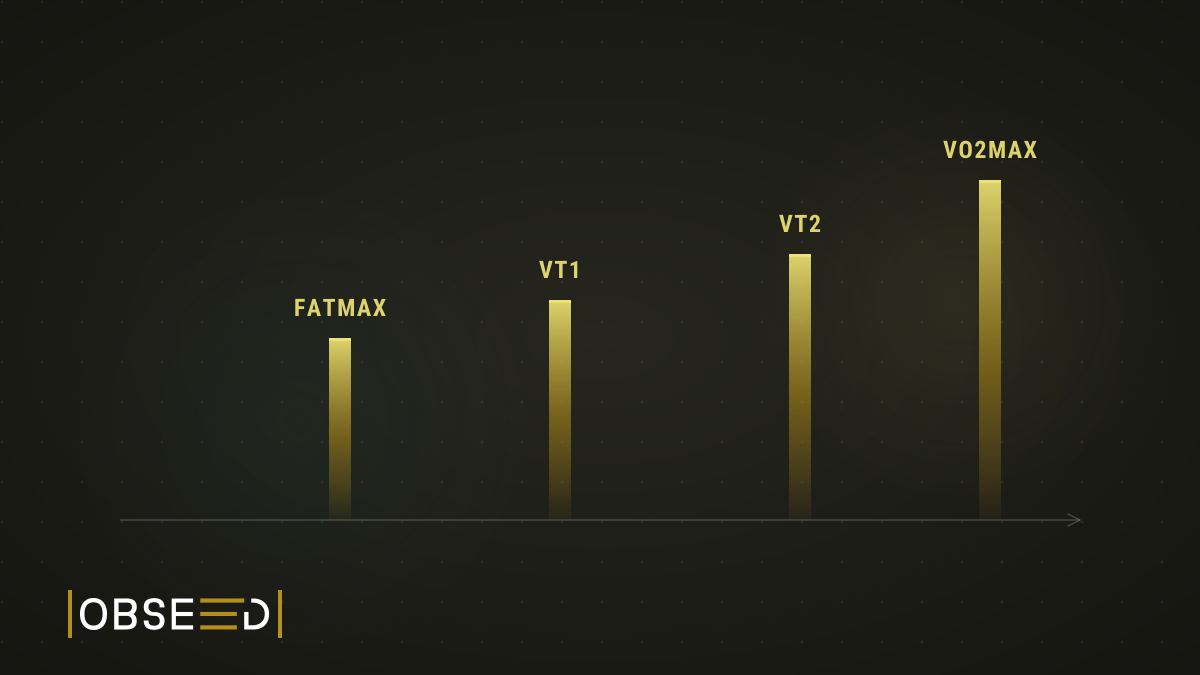
Thresholds and Maximum Values: The Who's Who of Diagnostics
VO2max only tells you what would theoretically be possible, not what your body actually uses of it. And when it comes to pinning down your second lactate threshold, not even the 72 recognised models can agree.

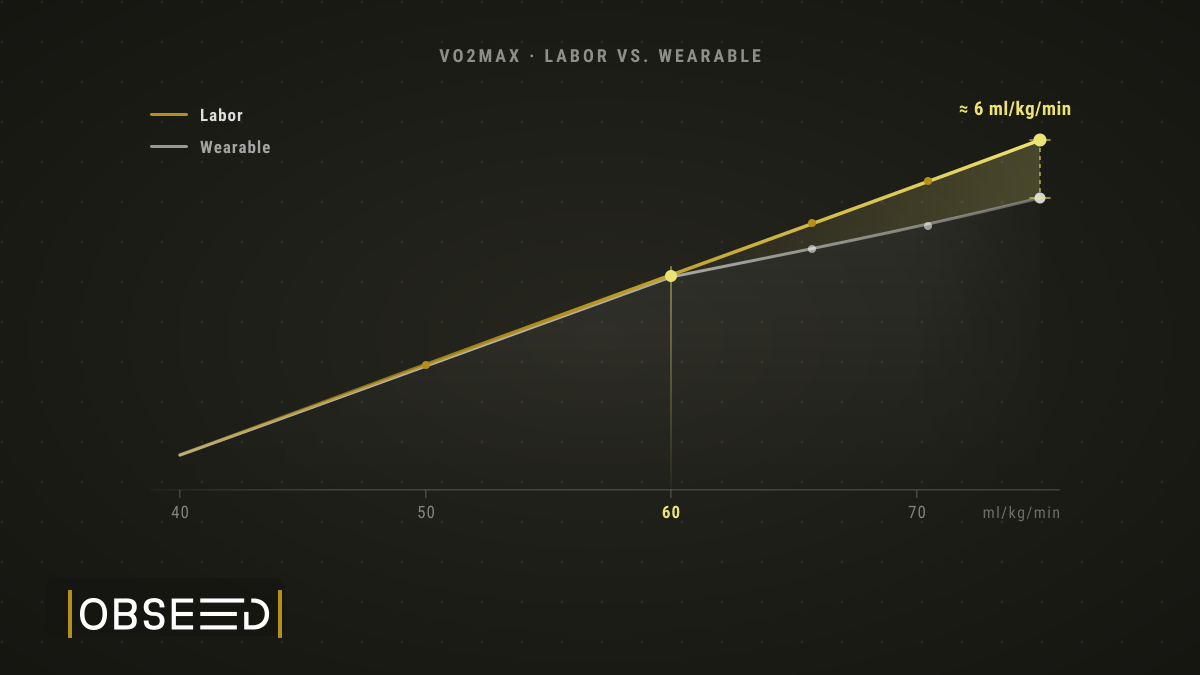
Lab or Wearable, That Is the Question: How Do I Know My VO2max Is Right?
A watch does not measure your VO2max, it estimates it. Why that estimate is surprisingly good for recreational athletes, and why it misses for the very best.
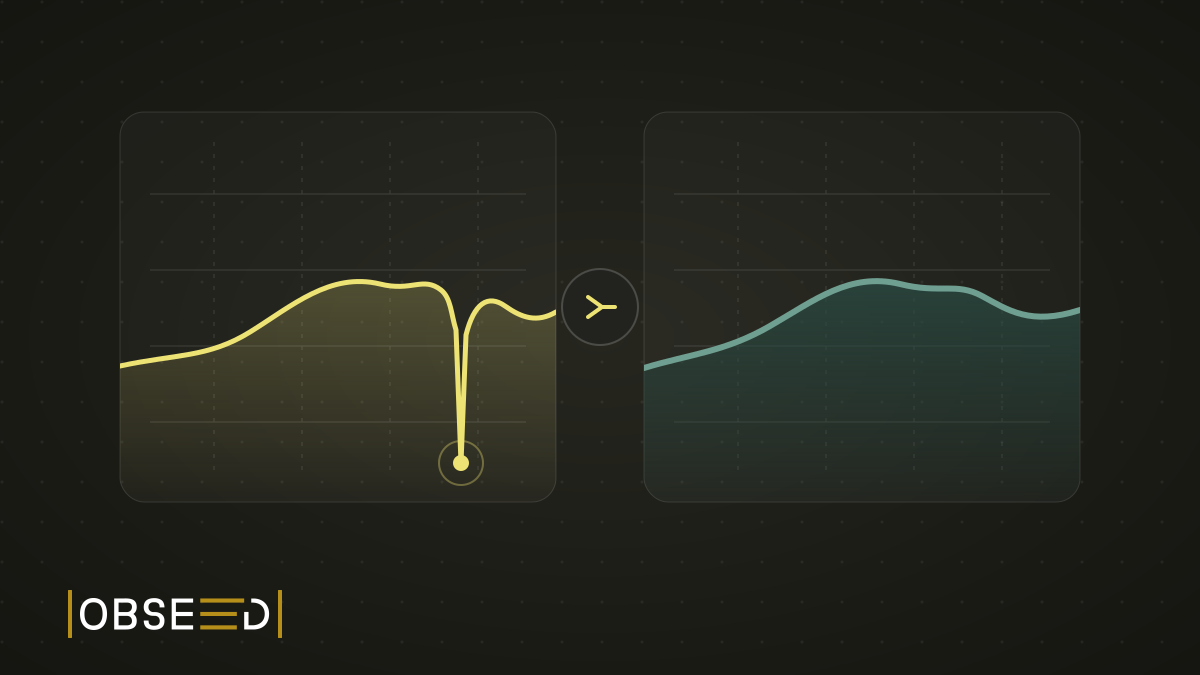
New Feature: The Mountain That Never Happened
My watch went for a swim in a fountain and invented roughly 100 metres of climbing. obseed now corrects errors like this automatically, including in your old sessions.
