Thresholds and Maximum Values: The Who's Who of Diagnostics
VO2max only shows what is theoretically possible, not what your body uses. On your second lactate threshold, not even 72 recognised models agree.

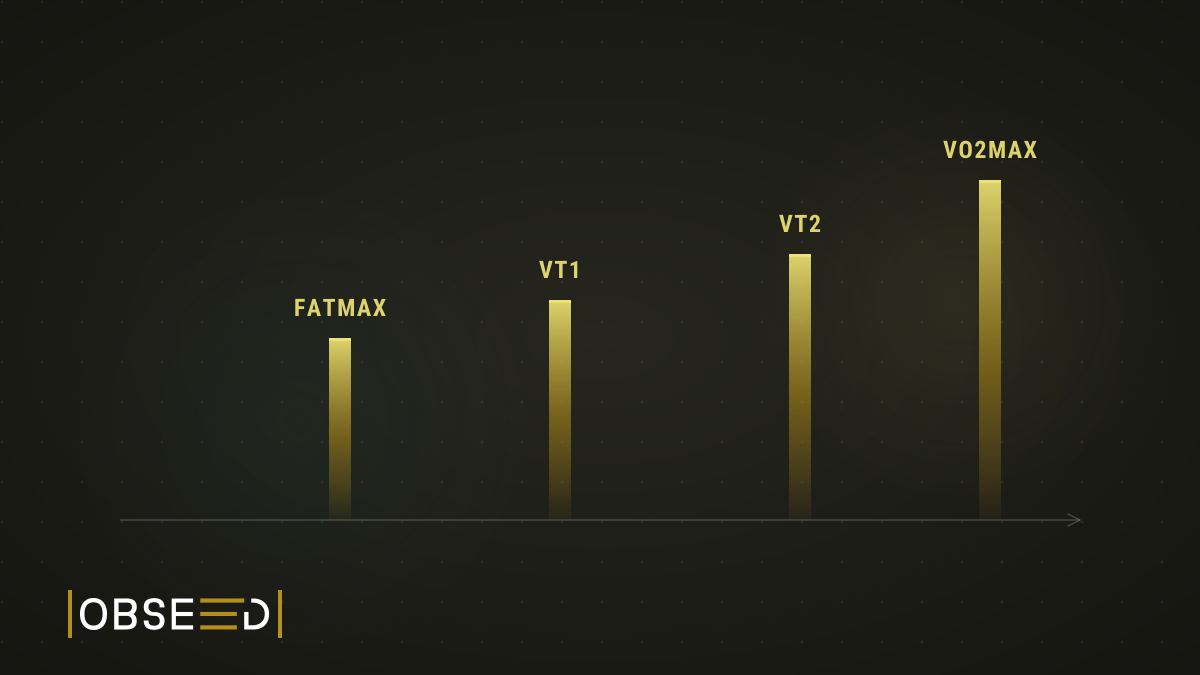
In part 1 of this short series we talked about the difference between a test and a diagnostic. Quick recap: both are about mapping certain reference points of performance. But a test, by our definition, shows WHAT the body does, while a diagnostic shows HOW it does it, which is objectively the far more important part. Part 2: thresholds and maximum values.
In this second part it’s now about thresholds and maximum values: what they actually are, how you can classify and use them, and what they tell you – or don’t.
Let’s start with the question: what actually is a threshold?
In diagnostics, and in sport in general, this term unfortunately has more than one meaning, for the simple reason that… well. Telephone game, remember? Let’s try to simplify it: in sport, a threshold marks either a transition point or a state of balance.
It helps here to look at the history of diagnostics: the “mother” of what we do today in well-equipped labs is spiroergometry. It happens to be a relatively well-researched branch of science: breath gas analysis was already being used more than 100 years ago to measure metabolic processes and functions in the body. Put very simply, most of what was later developed as alternative methods was essentially an attempt to simplify this rather elaborate form of diagnostic and bring it out into the field.
At first that worked very well, because the test and reference groups were very small and therefore representative of themselves. It only got difficult once mass sport became, well, more massive, and things like thresholds, steady states and maximum values started to matter in the amateur world too.
Back to our topic: so what actually is a threshold?
In the transition category, we’re mainly talking about two kinds: ventilatory thresholds and lactate thresholds. Oh, right: lactate! We need to talk about that too, but that’s a topic of its own.
The ventilatory thresholds mark, above all, two points that, as the name suggests, are determined through changes in breathing. The first ventilatory threshold, VT1 for short (VT = “Ventilatory Threshold”), marks the point where the body first perceives the effort being made as a strain. That’s exactly as simple as it sounds: entirely regardless of subjective feeling, several breathing parameters change to signal: from here on, no matter how you slice it, this isn’t easy anymore! Another term for this point is the “aerobic threshold”.
VT2, then, marks the point at which the body can no longer fully take up the oxygen it inhales. That’s the anaerobic threshold, described here as simply as it can possibly be put. Of course several other things happen here too, but what’s measured in the breathing are mainly these changes. After this point you can usually still take up more oxygen, just increasingly slowly, until at some point the maximum, and then maximal power output, is reached.
So how are these points actually determined?
Here the rule of in-vitro validation applies. Meaning: it’s not enough for ONE value to shout “threshold”, several have to agree. In this particular case that means: how does oxygen uptake (VO2) behave relative to carbon dioxide output (VCO2)? How do the ventilatory equivalents relate to each other (the ventilatory equivalent shows how much air you need to breathe to take up one litre of oxygen)? How does the end-tidal partial pressure of oxygen, respectively CO2, behave (end-tidal = at the end of the breathing cycle)? How does heart rate behave, how does breathing frequency?
These things are usually shown in four diagrams, three of which have to show the same result. Only then does a threshold count as validated.
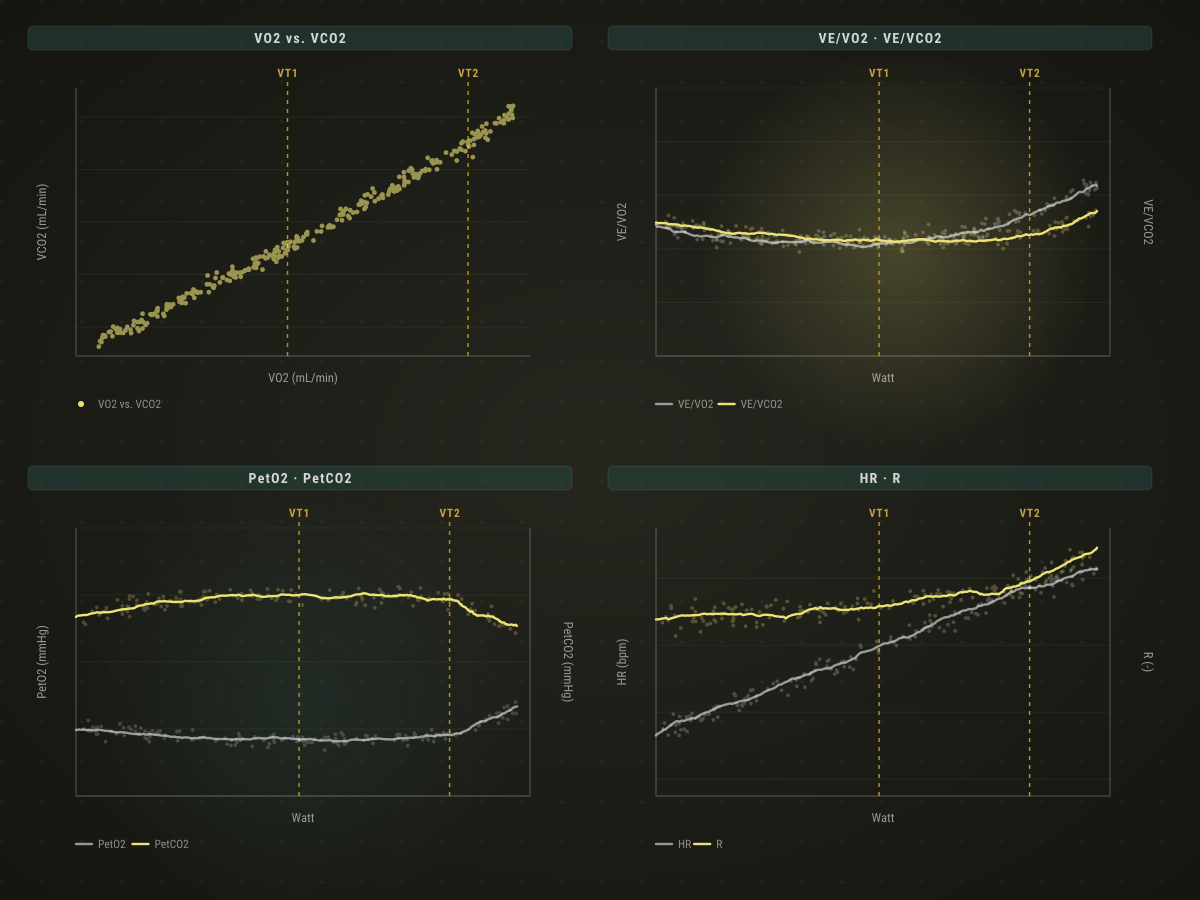
Four diagrams, two thresholds – only once at least three of them show the same result does a threshold count as validated. Schematic illustration, not real measurement data.
…and what do we actually need these thresholds for?
Primarily, they help evaluate the body’s general performance capacity and build a metabolic profile. That’s essentially the blueprint of performance, and it can also be used to map out individual training zones.
And what about lactate?
Here it’s actually simpler, at least at first glance. Because the values we call lactate thresholds today represent an attempt to find the complex determination and validation described above with far fewer measurement points (specifically: one), and to reproduce it out in the field too. In a step test, for example, blood lactate concentration is measured after every step and noted in mmol/l. That produces a curve, and its shape is used to find said thresholds. The definition is also considerably simpler: LT1 (lactate threshold) was originally meant to correspond to VT1, and is defined as the point at which blood lactate concentration reaches its lowest value and then starts rising again. LT2, then, was meant to reflect VT2. You find it by… oh. Hold on.
Here we run into one of the most persistently swept-under-the-rug problems of sports science: as things stand today, there are actually around 72 recognised models, or methods, for determining LT2. And that’s not all: every single model rests on a specific, small test group and a predefined protocol. So the most exact definition of the second lactate threshold is probably: roughly around VT2.
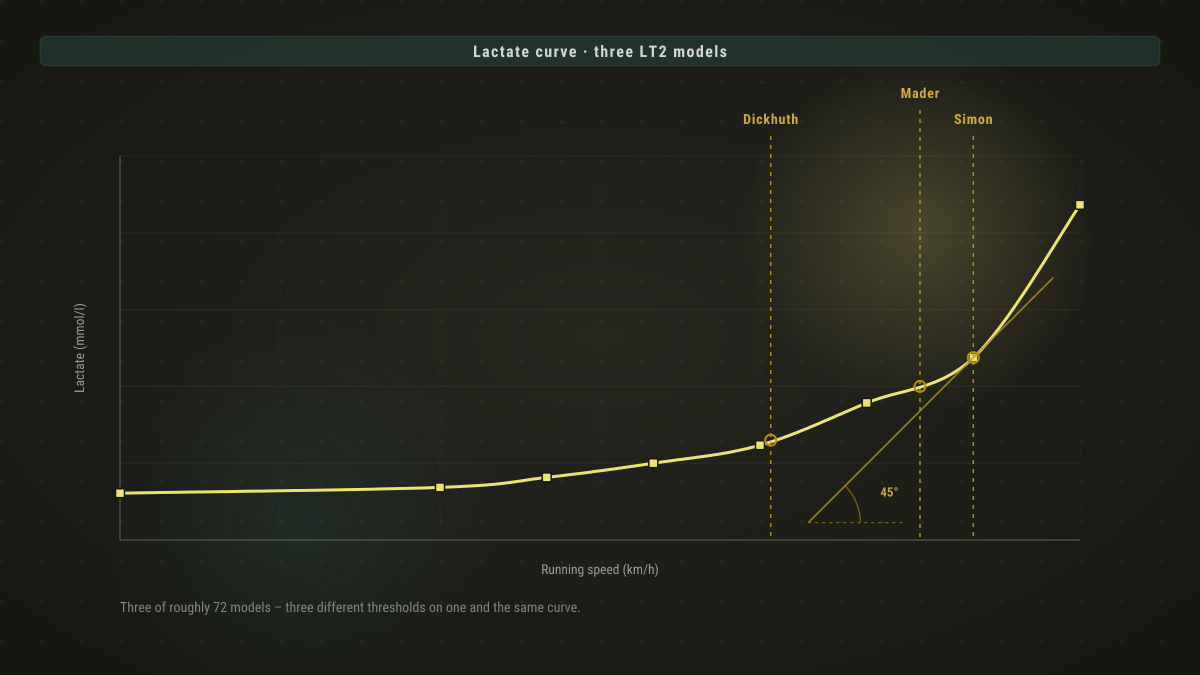
The same curve, three models, almost four km/h apart – and those are just three out of roughly 72. Schematic illustration, not real measurement data.
So which is better: lactate diagnostics or spiroergometry?
That ultimately depends entirely on what you want to know. If you want to find out how the body works and how to train it sustainably, there’s still no way around spiroergometry today. Lactate measurements can complement this diagnostic and, applied correctly afterwards, serve as a better guide in training, but no matter how you look at it, metabolism can still only really be measured through breathing.
Which brings us to the maximum values, where the same thing comes into play.
Essentially, two peaks get determined here in diagnostics: maximum fat burning (FatMax) and maximum oxygen uptake capacity (VO2max).
Both of these values also tend to get misinterpreted a little. Let’s start with VO2max: it’s commonly described as “endurance capacity”, from which the conclusion follows: the higher, the better.
It would be more accurate, though, to call it endurance POTENTIAL. And whether that potential actually gets used is an entirely different question.
For one, the difficulty lies in the fact that calculated formulas don’t necessarily have to represent reality. We’ve already talked about that. So it’s important to understand that the standalone VO2max value only tells you what could theoretically be taken up into an athlete’s “tank”. To see how efficiently that “fuel” is actually being used, you need to analyse the “end consumer” — in this case, our cells.
Which brings us to FatMax. It shows us several things at once: on the one hand the obvious value, the maximum amount of fat (expressed in grams per hour, g/h) that can be used for energy production. On the other hand, it also gives insight into at what power output that happens, which in turn shows how well-developed the metabolic base, and with it the use of oxygen, actually is.
If a high VO2max is measured (let’s take the 55.0 mL/min/kg at 70kg body weight already used above, so 3.85 L/min absolute), but the maximum fat burning comes out at 8 g/h at, say, 100 watts, the athlete’s potential is probably very large, but how much of it actually gets used is more or less nonexistent.
Could it be that my numbers are that low? How likely is that?
Short answer: yes. As already mentioned in our first article in this series, the odds that your maximum fat burning falls within a calculated, estimated range are roughly 1 in 1000. So it’s worth having these things examined, because they can make the difference between sustainable, long-term successful training and a system that runs itself into the wall sooner rather than later.
If you’re now wondering what that means for your own training: thresholds and maximum values can also be imported directly into obseed. With our Energy Spread you can link these values directly to your training sessions, and see in black and white whether your training actually hits where VT1, VT2 and FatMax say it should — not just where a formula assumes it does.
In the next part of this series we’ll get into training zones, where we’ll bring our topics together.
Stay tuned!
Read Next
Performance Test vs. Diagnostic: What Is the Difference?
A test shows you WHAT a body can do. A diagnostic shows you HOW it does it. Why that difference decides whether your Zone 2 is actually a Zone 2.

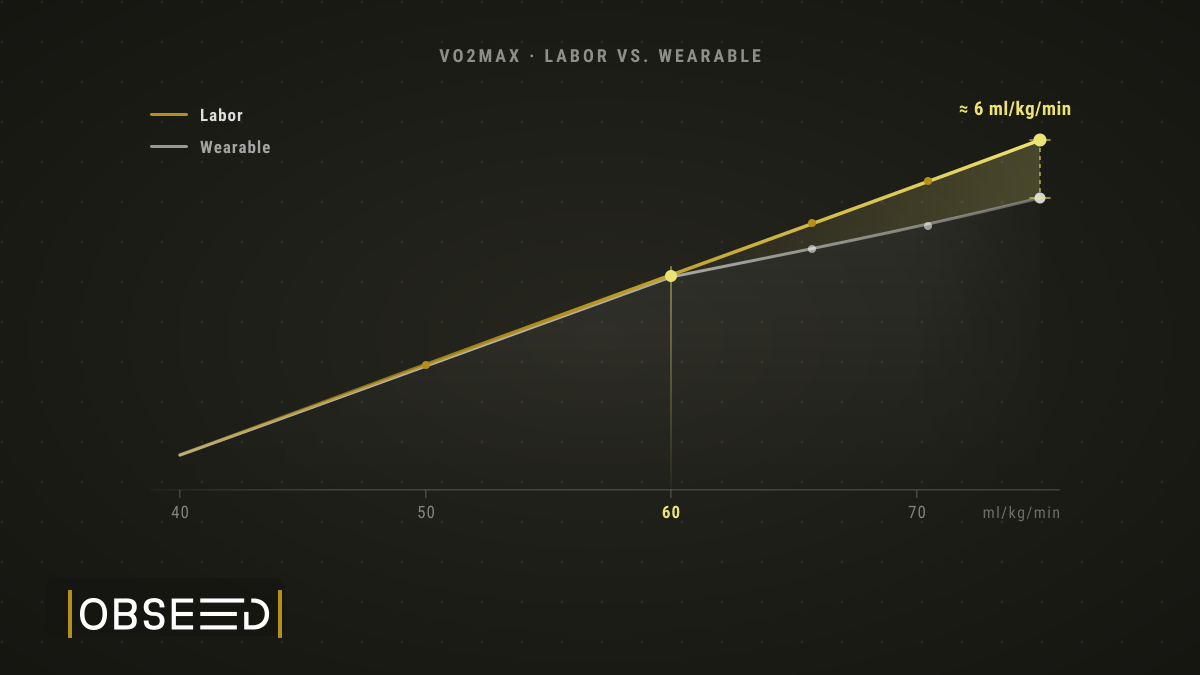
Lab or Wearable, That Is the Question: How Do I Know My VO2max Is Right?
A watch does not measure your VO2max, it estimates it. Why that estimate is surprisingly good for recreational athletes and misses for the very best.
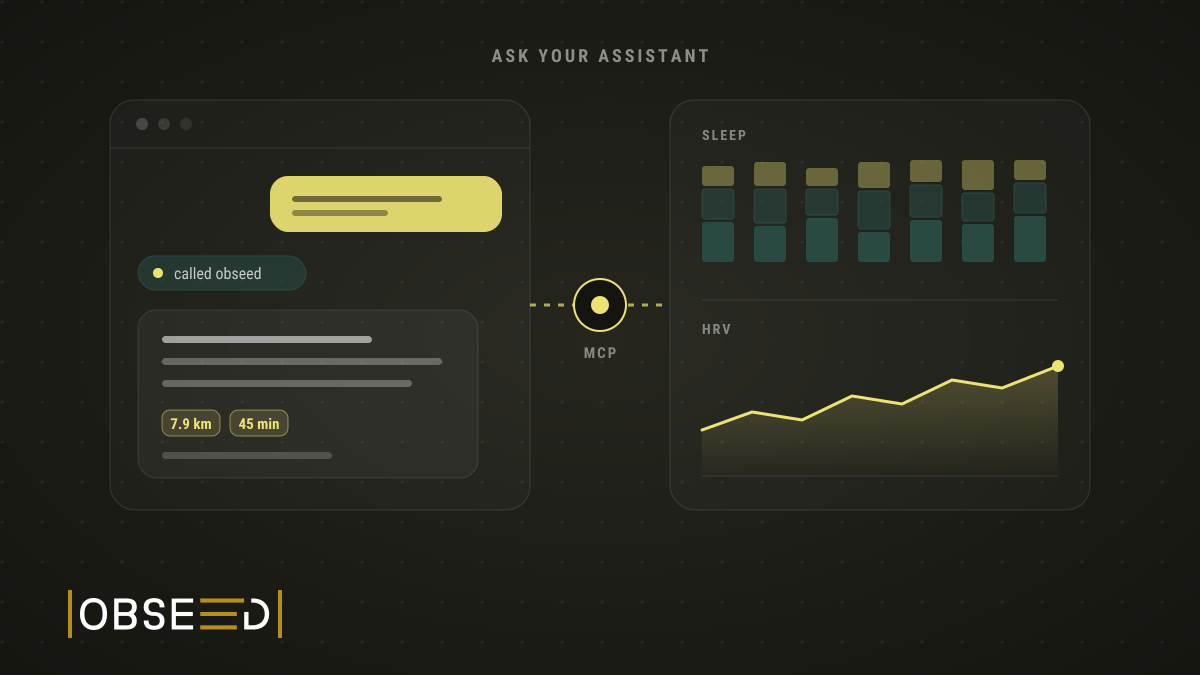
New Feature: Ask Claude About Your Training
I ask Claude and ChatGPT about my sleep, HRV and training. Now they also log tags and session details, once I confirm in obseed.
