Two Scales, Two Body Fat Readings: Which Do You Trust?
The same 634 mornings, two scales, 6 to 9 points apart on body fat. What the numbers are good for, and which app setting explains almost the whole gap.

A user on the Garmin forum writes: “Garmin measured me this morning at 23.6% body fat”. Three hours later came the DEXA scan, and it said 14.8% (original).
Almost nine points off. That’s not an outlier, it’s a known pattern.
Part one was about weight. The result there: the scale measures correctly, the body fluctuates. Body fat is different. There, the scale estimates.
Weight is measured, fat is estimated
A scale with electrodes sends a small current through your body and measures the resistance. Water conducts well, fat conducts poorly. From the resistance, the scale uses a formula to work out body fat, muscle and water. The technical term is bioimpedance.
That means: anything that shifts your water also shifts your body fat. And every brand uses a different formula.
How much, the poker night from part one shows. For the night with +1.6 kg, the Withings reported +1.69 kg of muscle and −0.15 kg of fat. For the same night, the Garmin reported +0.39 kg of fat, +0.39 kg of muscle and +0.96 kg of water. Muscle doesn’t grow by a kilo and a half overnight. Someone on Instagram summed it up for a week like this: “Linda, you have not lost two kilos of muscle in a week” (original).
A study of 106 adults (Bosy-Westphal et al., 2008) compared four home devices against DEXA and MRI. For body fat percentage, the device with eight electrodes, measuring through hands and feet, deviated least. The scales that measure through the feet only were clearly further off: with little body fat they showed too much, with a lot of body fat too little. The study was funded by the maker of the eight-electrode device. Both of my scales measure through the feet only.
My two scales
Since December 2024 I’ve stepped on two scales every morning: Withings and Garmin Index. One right after the other, in the same state. 634 days with both readings.
On weight, they’re practically identical. The Garmin shows 0.17 kg less on average, the spread is small (±0.24 kg), the correlation is 0.97. Then there’s a third scale, a Seca at a clinic. On average it showed 0.42 kg less than the Withings (5 measurements) and almost exactly the same as the Garmin (0.02 kg more, 10 measurements), even though I stood on it at different times of day.
On body fat, they’re not. Since the calibration I’ll get to in a moment, the Garmin shows 6.2 percentage points more than the Withings on average. Before, it was 8.9. From day to day, the two only loosely move together: since the calibration, the correlation of the daily values is 0.61, compared with 0.96 for weight over the same period. In the morning, same body, same moment.
There’s no getting around it: on the absolute value of body fat, the two scales don’t agree, and on the daily ups and downs only partly. Where the gap in the absolute value comes from, a test further down shows.
Weighed the same, estimated differently
Garmin minus Withings on the same morning at 06:00, from the calibration on Feb 20, 2026 to Oct 19, 2026.
Never mix values from two scales. Within one scale, the change is what counts.
One entry, three points less
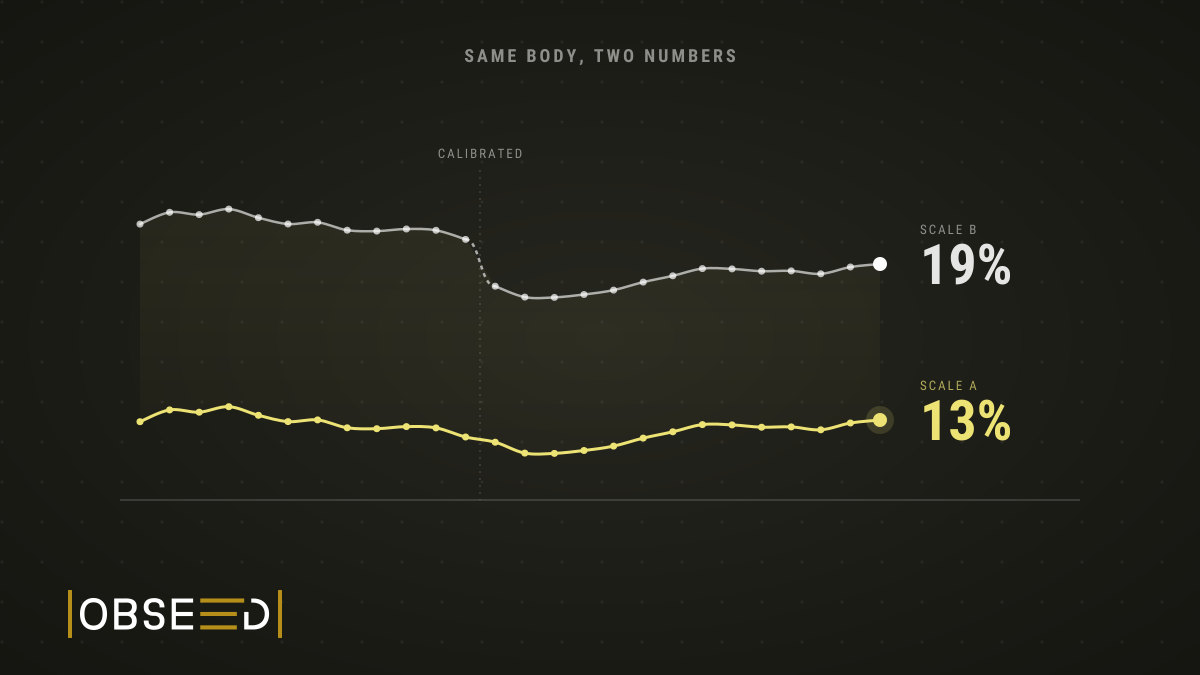
On the Garmin, I saw a step. On February 19, 2026 it showed 22.6%, on February 20 it showed 19.4%. The Withings stayed the same (13.36 to 13.38).
I had calibrated the Garmin. In January I’d had a Seca measurement (19.4%), and I entered that value as a reference in the Garmin app: Garmin Connect, Devices, Index S2, User Settings, “Set Body Composition” (path according to the Garmin forum). The recommendation there is a measurement no older than 30 days. Mine was 21 days old. From that day on, the scale showed three points less body fat.
And not only that. From the same day, the Garmin also estimated water differently, plus 2.4 percentage points. So a single reference value shifts several readings at once.
One entry in the app, three points less
Body fat in %, 7-day mean, Jan 4, 2025 to Oct 19, 2026. Top: Garmin as the scale displayed it. Bottom: adjusted for the calibration. Seca: single readings at varying times of day, not part of the morning protocol.
On Feb 20, 2026, Garmin got the Seca value from Jan 30 as its reference and from then on showed 3.08 points less. Without this intervention, both scales fall over the whole period, Withings by 2.35, Garmin by 0.95 points. The direction matches, the amount doesn’t.
Take the step out, and something nice happens. The correlation of the 90-day changes between the two scales jumps from 0.27 to 0.86. That’s a rough number: my 21 months contain only seven independent quarters. And the adjustment assumes the calibration shifted everything by the same amount. With the raw numbers, it looked as if the scales weren’t measuring the same thing. Without the step, they point the same way for months.
One setting, six points
That leaves the question of where the gap of six points comes from. In the Withings app, I have athlete mode switched on, in the Garmin app activity level 8. Both tell the formula: this body trains a lot, use different assumptions.
So on October 20 I measured again. Fasted, eleven weigh-ins in nine minutes, alternating between both scales, switching the settings in between and back again. With athlete mode, the Withings showed 12.2 to 14.0% body fat, without it 18.6%. My weight varied by at most 0.3 kg. Without athlete mode, the Withings was only 0.4 points away from the Garmin. That’s a single morning, and only two weigh-ins without athlete mode. The evening before, I was in the sauna and the steam bath. All eleven weigh-ins happened in the same state, so the comparison of the settings still holds. The absolute values may be slightly shifted, by about 0.2 points according to my data (more on that below).
The Garmin stayed at 19%, whether level 8 or 5. I see two possible explanations. Maybe the new setting hadn’t reached the scale yet. On the Withings, too, the change only arrived one reading later. Or the calibration from February overrides the activity level.
So the setting explains almost the whole gap between my scales, and also the gap to the Seca, which the Withings sat around 6.5 points below. Which of the two Withings numbers is right, the test doesn’t say. It only shows: one setting in the app shifts the body fat reading by more than twice as much as it has dropped in 21 months.
If your scale has an athlete mode or an activity level: check what it’s set to, and don’t change it in the middle of a series of measurements. Otherwise you’ll see a step your body never took.
Direction yes, amount no
That’s the crux. The amount, meaning the number on the display, is no good for comparisons. Not between brands, not with a DEXA scan. The trend over months, on the other hand, is useful, as long as it’s the same device and the same routine.
In short: one device, one protocol, one quarterly trend.
And for short time spans, the same applies as for weight. After a sauna or a steam bath, my weight the next morning was about 0.3 kg lower on both scales (median, around 50 times each). On body fat, they disagree again: the Withings showed 0.21 points more, the Garmin 0.1 points less. Less water in the body, the current flows less easily, and depending on the formula that turns into more fat, or not. I don’t have more fat. I have less water. As with all labels: a missing label means “not logged”, and the baseline is all mornings.
Strength, muscle and the scale
Finally, the question I hear most often myself: can you see on the scale whether your muscles are growing? I lined up my strength sessions in 28-day blocks against the muscle mass from both scales. The correlation is −0.04 (Withings) and −0.28 (Garmin), with around 22 blocks per scale. No usable signal.
Lots or little strength training: the muscle number scatters the same
Per scale, the 28-day blocks split into thirds by number of strength sessions. Values: change in measured muscle mass to the next block.
No visible link doesn’t mean strength training builds no muscle. Progress shows more reliably in performance, measurements or photos. What “muscle mass” means on the two scales is shown in the chart “Weighed the same, estimated differently”.
What I can’t conclude from this: whether the scales don’t see muscle gain, or whether I simply built hardly any muscle while in a calorie deficit. On top of that, the blocks with lots of strength training all date from 2025, the ones with little rather from 2026. The only sure thing: if you want to see muscle gain, in my data you won’t find it on the scale. The fluctuations from water are bigger than anything a few weeks of training could move.
My protocol from now on
For weight, I look at both scales, they agree. For body fat, I only look at the quarterly trend of a single scale. I no longer compare the number on the display with anything, neither with the other scale nor with a scan.
I’m leaving the settings as they are. An athlete mode that shifts the value by six points isn’t a problem as long as it’s always on. It only becomes one when you switch it in the middle of a series of measurements. The same goes for the calibration: it brought the Garmin closer to the Seca and left a step in my curve that I’ve had to adjust for ever since.
When you look at your scale’s body fat number: remember that it’s an estimate. Watch the trend over months, not the morning. And if you enter a reference value anywhere, write down the date. Otherwise, six months from now you won’t remember why the curve has a kink.
Sources
Read Next
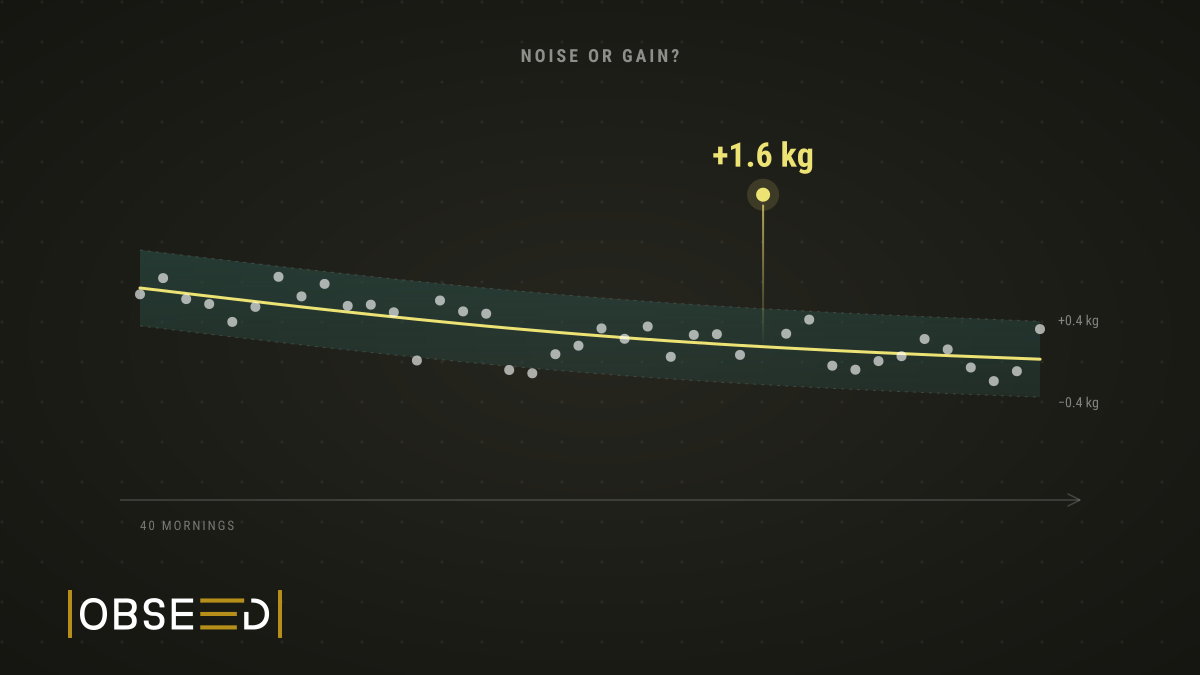
Gained 1.6 kg Overnight? What Your Scale Is Not Telling You
I weigh myself on two scales every morning. After a poker night, both showed +1.6 kg. What in my data is noise, and when you can see the real direction.


Lab or Wearable, That Is the Question: How Do I Know My VO2max Is Right?
A watch does not measure your VO2max, it estimates it. Why that estimate is surprisingly good for recreational athletes and misses for the very best.


The Tracker Tango in the Data Jungle: Which Device Should I Believe?
Whoop says rest day, Garmin says threshold training. Why wearables contradict each other, and why your measurement method matters more than who is right.