Your Nervous System, Decoded: HRV Analytics in obseed
60+ HRV metrics across 9 physiological categories from your wearable. Research-grade analysis: Poincaré, DFA alpha-1, multiscale entropy, personal baseline, and 15-page reports.


Your wearable shows you a number after every activity: heart rate, calories, maybe a recovery score. But what happens between the heartbeats — the milliseconds governed by your autonomic nervous system — stays invisible. Until now.
We’ve built HRV Analytics. Not another dashboard with a single number, but a complete research pipeline that computes over 60 metrics across 9 physiological categories — straight from the RR interval data your wearable already records. Garmin, Wahoo, or Polar. No lab coat required. The motivation came from our own frustration. We’d stare at a daily HRV score of 45ms and ask: Is that good? For me? Today? No wearable could answer that. So we built the tool we wanted for ourselves.
One Number Is Not Enough
A meta-analysis of 6 randomized controlled trials found that HRV-guided training produced a meaningful effect on VO2max (effect size = 0.40) compared to predefined training (ES = 0.22), with amateur athletes and women benefiting most (Montalvo-Perez et al., Int. J. Environ. Res. Public Health, 2020). That deeper benefit comes from analyzing HRV properly, not from glancing at a single score. Most wearable apps show HRV as a single daily value — often RMSSD or a proprietary score.
Behind that one number lie dozens of independent dimensions: How dominant is the parasympathetic system? How complex is the heart rhythm across different time scales? Are there recurring patterns suggesting fatigue? How has autonomic balance shifted compared to your last 30 days?
A single score can’t answer these questions. That’s why we built something that can.
9 Categories, 60+ Metrics
Most apps still offer surface-level analysis. obseed goes deeper with 9 physiological categories: Time-domain — RMSSD, SDNN, SDSD, pNN50, mean RR interval, and more. The classic measures of overall heart rhythm variability.
Frequency-domain — VLF, LF, and HF power, LF/HF ratio, peak frequencies. Shows how the activity of your sympathetic and parasympathetic nervous system is distributed.
Nonlinear dynamics — DFA alpha-1 and alpha-2 (fractal scaling), Poincaré scatter with SD1/SD2, Sample Entropy. Captures the complexity of your heart rhythm — healthy hearts are complex, not monotonous.
Geometric — Triangular Index, TINN, symbolic dynamics, and fragmentation. Distribution-based measures that are robust against individual outliers.
PRSA — Deceleration and Acceleration Capacity. Show how quickly your heart responds to changes.
Respiratory — EDR-based breathing rate estimation derived from the RR intervals themselves.
Recurrence quantification — Recurrence rate, determinism, and recurrence entropy. A heatmap visualization that reveals hidden state transitions.
Multiscale entropy — Sample Entropy across 20 time scales. Detects at which levels complexity is lost.
Exercise physiology — TRIMP (training load), Stress Index, MxDMn, AMo50, and experimental DFA alpha-1 crossover analysis for hints at ventilatory thresholds.
Why 9 categories and not just RMSSD? Because your autonomic nervous system doesn’t operate in one dimension. Each category answers a different question about your physiology.
DFA Alpha-1: Promising, With Caveats
A 2024 study in Frontiers in Physiology found that DFA alpha-1 thresholds at 0.75 (aerobic) and 0.50 (anaerobic) showed high reliability during incremental cycling: ICC = 0.87 for HRVT1 and ICC = 0.97 for HRVT2, with strong validity against lactate and ventilatory thresholds (r = 0.93 and r = 0.92 respectively) (Mateo-March et al., Frontiers in Physiology, 2024). One caveat: A separate 2024 study found sex-based differences, with approximately 4.7 bpm overestimation at VT1 in female athletes, and test-retest typical error of 6–8 bpm (Rogers et al., Journal of Sports Sciences, 2024).
obseed visualizes these DFA alpha-1 crossover points as experimental indicators — they’re promising research tools, but we don’t present them as validated lab replacements. That distinction matters to us.
Wrist vs. Chest Strap: The Accuracy Gap
A 2025 study in Frontiers in Physiology measured the gap directly: chest strap RMSSD error was just 2.16% MAPE compared to clinical ECG, while smartphone PPG showed 17.49% — an 8x difference in accuracy (Frontiers in Physiology, 2025). Both devices showed acceptable intra-session reliability (RMSSD ICC 0.83–0.90). It gets worse during movement. A 2025 validation study found that wearable PPG accuracy degrades dramatically: one device’s MAPE jumped from 0.49% while sitting to 26.83% while cycling — a 54-fold increase (PMC, 2025). That’s why obseed doesn’t treat all data equally.
Every analysis in obseed gets a validity tier — high, moderate, or low — based on signal source, artifact percentage, and context. You see exactly how many beats were removed, corrected, or kept. No silent averaging.
8 Charts, 8 Different Questions
Each analysis generates 8 distinct chart types. They aren’t decorative — each one answers a different question about your physiology:
- Poincaré scatter plot — Beat-to-beat variability in two dimensions. The shape of the ellipse reveals parasympathetic tone.
- RR interval histogram — Distribution of heartbeat intervals. Narrow? You’re stressed. Wide? You’re recovered.
- Frequency spectrum — VLF/LF/HF power bands. Sympathetic vs. parasympathetic, decomposed.
- Multiscale entropy — Complexity across 20 time scales. Healthy hearts are complex; rigidity signals trouble.
- Recurrence diagram — A heatmap of hidden rhythm patterns and state transitions.
- DFA scaling plot — Fractal analysis with alpha-1/alpha-2 regression lines.
- Autonomic balance gauge — PNS/SNS indexes compared against your personal 30-day baseline.
- Windowed trends — RMSSD, SDNN, DFA alpha-1 tracked across the activity with threshold overlays.
Your Baseline, Not Someone Else’s
A single measurement says little. Is an RMSSD of 45ms good or bad? That depends entirely on your normal. obseed builds a rolling baseline over 30 days, based on your own activities of the same sport type.
Each new analysis is compared against this baseline: z-scores show how far a value deviates from your normal range. Percentile badges make it visible at a glance whether a session was exceptional (p95), typical (p50), or concerning (p5). We’ve found that the baseline comparison is what athletes actually look at daily — not the raw metric values. It turns abstract numbers into actionable signals: “My RMSSD is 1.5 standard deviations below my 30-day norm” tells you more than “RMSSD = 35ms” ever could.
The Missing Piece: Context
Alongside the HRV metrics, obseed shows the Universal Tags you recorded on the same day — caffeine intake, sleep quality, medication, stress, sauna visits. Recorded 6 coffees and had a terrible HRV? Now you don’t just see the number — you see the why.
A single tag entry correlates automatically with all your connected devices — Garmin, Oura, Whoop, Withings. No manual analysis.
Supported Sports
HRV Analytics works with any activity where your wearable records RR intervals. That covers a wide range:
Endurance sports: Running, cycling (indoor & outdoor), swimming (with a waterproof chest strap), rowing, ergometer, cross-country skiing, hiking, and trekking.
Strength & functional training: Weight training, CrossFit, HIIT, kettlebell training, and bodyweight workouts.
Multi-session activities (warm-up, main set, cool-down) are broken down individually, each with its own full metric suite. For best data quality, we recommend a chest strap — especially during activities with heavy arm movement. The automatic validity classification transparently shows you how reliable the data from each session is.
The 15-Page Research Report
Each analysis can be exported as a printable PDF — 15 pages with all metrics, all 8 charts, and the complete preprocessing history. We’ve designed these reports to be shareable: professional enough for a sports scientist or physician, accessible enough for your training diary.
The preprocessing section is something we’re particularly proud of. It documents exactly how many beats were removed (plausibility), corrected (ectopic via cubic spline interpolation), and kept — with artifact percentages and correction methodology. Total transparency.
Disclaimer: obseed is not a medical device. HRV analysis does not replace medical diagnosis or treatment. DFA-alpha-1-based threshold hints are experimental and should not be used as a substitute for lab-based diagnostics. Always consult a healthcare professional for medical concerns.
Frequently asked questions about HRV Analytics
Heart rate variability describes the fluctuation in time intervals between consecutive heartbeats (RR intervals). Higher variability indicates a flexible, adaptable autonomic nervous system — a sign of good recovery and fitness. A 2021 meta-analysis found that HRV-guided training improved vagal modulation with a standardized mean difference of 0.50 compared to predefined programs (Granero-Gallegos et al., Sports Medicine, 2021).
Any Garmin, Wahoo, or Polar device that records RR intervals is compatible — most models from the last 5 years qualify. Both chest strap and wrist-based heart rate monitors work. A 2025 Frontiers in Physiology study measured chest strap RMSSD error at just 2.16% MAPE vs. ECG, while wrist PPG showed 17.49% — obseed assigns validity tiers accordingly.
No. obseed HRV Analytics works with wrist sensors too. But accuracy differs: a 2025 JMIR Cardio study found arm-worn PPG achieves 1.35% MAPE vs. ECG, while wrist-worn shows 6.82%. obseed automatically evaluates signal quality and assigns each recording a validity tier (high, moderate, low).
DFA alpha-1 is a fractal scaling exponent from Detrended Fluctuation Analysis that describes heart rhythm complexity. A 2024 Frontiers in Physiology study found high reliability (ICC = 0.87–0.97) for DFA alpha-1 thresholds at 0.75 (aerobic) and 0.50 (anaerobic). obseed visualizes these crossover points as experimental early indicators — not validated replacements for lab testing.
No. HRV Analytics is included in your obseed subscription at no additional cost. Connect your Garmin, Wahoo, or Polar, record an activity, and the analysis is generated automatically with all 60+ metrics, 8 chart types, and a printable 15-page research report.
Read Next

How to Use HRV for Smarter Training Decisions
A practical guide to HRV-guided training for endurance athletes. Learn how to read your morning HRV, when to push hard vs rest, and how to avoid the most common mistakes.

New Feature: Wahoo Integration – Your Cycling Workouts in obseed
obseed now integrates with Wahoo ELEMNT, KICKR, and BOLT — automatically syncing your cycling workouts, power zones, and FTP from full FIT file imports.
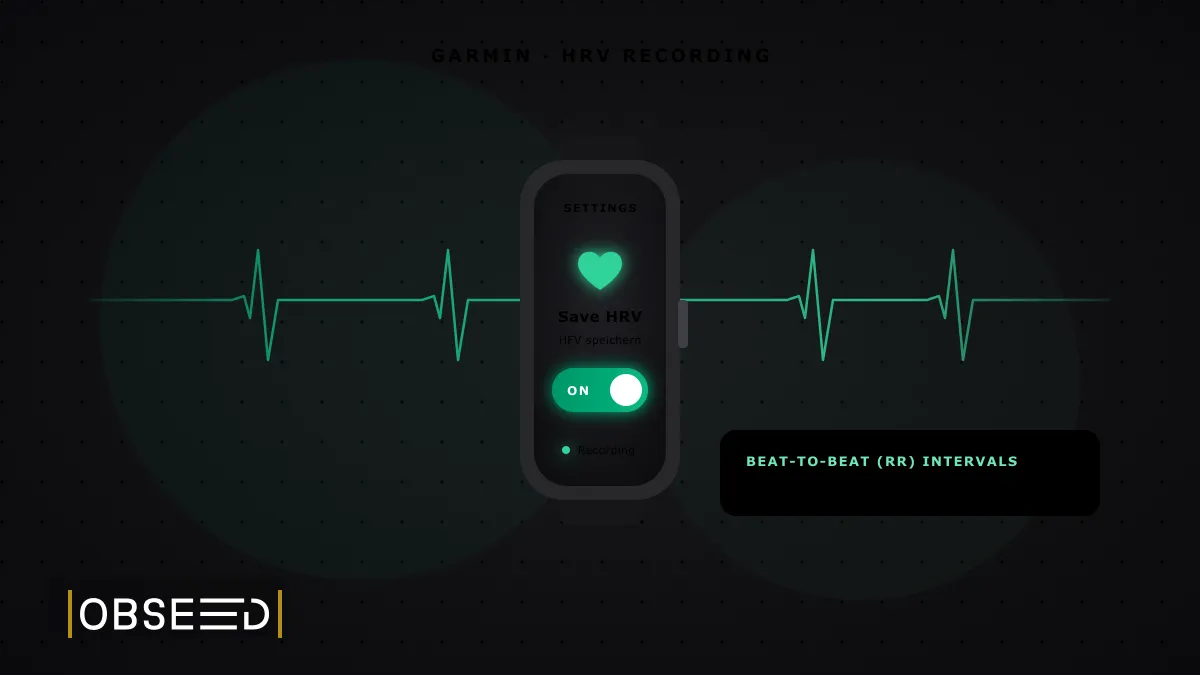
Garmin & HRV: Turn On Recording — and Re-Check It After Every Update
On many Garmin watches HRV recording is off by default and gets reset by firmware updates. Here is how to enable it so obseed can analyse your heart rate variability.