Acute Training Load (ATL)
Acute Training Load (ATL) is the exponentially weighted average of daily Training Stress Score over roughly 7 days and quantifies short-term fatigue.
Definition
“Acute Training Load” (ATL) is an exponentially weighted moving average of the daily Training Stress Score (TSS) with a time constant of about 7 days. The value quantifies short-term training load and the fatigue that comes with it. The term was coined by TrainingPeaks as part of the Performance Management Chart and traces back to Banister’s impulse-response model.
The calculation follows this formula:
ATL_today = ATL_yesterday + (TSS_today − ATL_yesterday) × (1 − e^(−1/7))The factor 1 − e^(−1/7) is roughly 0.133. Each new day therefore contributes about 13% to the value, while older days lose weight accordingly.
Why it matters
ATL reflects the impact of current training and stands in direct relation to “fitness”, the Chronic Training Load (CTL). The difference CTL − ATL yields the Training Stress Balance (TSB), i.e. form.
| Relationship | TSB | Typical situation |
|---|---|---|
| ATL < CTL | positive | Recovery or taper phase, form rising |
| ATL ≈ CTL | around 0 | Stable training at the usual level |
| ATL > CTL | negative | Intensive build phase, fatigue dominates |
During an intensive training block with high volume or high intensity, ATL usually sits well above CTL. The rate at which ATL rises (the “ramp”) indicates how much recovery will be needed to actually adapt to the stimuli applied.
One caveat matters: ATL can be lowered purely arithmetically by scheduling low-TSS sessions instead of complete rest days. That is mathematical “recovery”, not physiological recovery. Whether such a session is genuinely regenerative can only be judged with the metabolic profile and performance-diagnostic data in hand.
How obseed measures it
obseed calculates ATL from the TSS of every recorded session, whether imported from wearables and head units or entered manually. The value appears as part of the form curve directly on the dashboard, together with CTL and TSB:
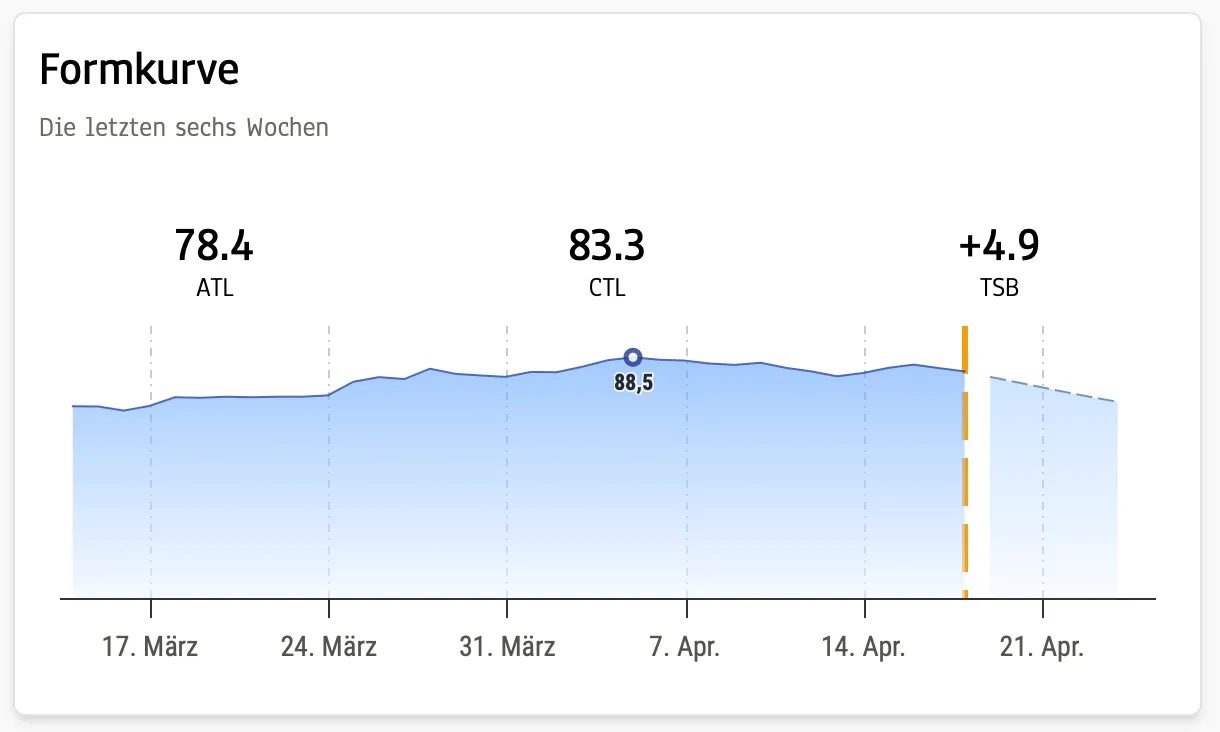
Because TSS is based on a threshold value, ATL is only as good as that threshold. obseed therefore recommends storing a reference from a metabolic assessment rather than a field test, so the fatigue curve rests on measured rather than estimated quantities.
Example
An athlete starts the week with an ATL of 60 and a CTL of 65.
| Day | TSS | Calculation | New ATL |
|---|---|---|---|
| Monday | 150 (hard intervals) | 60 + (150 − 60) × 0.133 | 72.0 |
| Tuesday | 0 (rest day) | 72.0 + (0 − 72.0) × 0.133 | 62.4 |
| Tuesday, alternative | 30 (easy ride) | 72.0 + (30 − 72.0) × 0.133 | 66.4 |
After the hard Monday, ATL exceeds CTL and TSB turns negative (65 − 72 = −7). A full rest day lowers ATL by 9.6 points, the easy ride by only 5.6. The gap shows that a “recovery session” does push the number down, but less than real rest, and that the number itself says nothing about whether the body has actually recovered.
References
- Banister, E. W. et al. (1975): A systems model of training for athletic performance.
- Allen, H. & Coggan, A.: Training and Racing with a Power Meter.
Categories
- Trainingssteuerung